Urban Fieldworks
Urban Fieldworks is an exercise that investigates the ordinary happenings and encounters found within an urban landscape.
FURNOMENON
Nowadays, stray cats can’t exactly be considered a strange sight anymore. They have become part of our society and have integrated into our ecosystem. However, we seek to observe a relationship between the community and its environment with the stray cats. On this field trip, we will gather the data by counting the number of strays we come across in different locations throughout Singapore and accumulate photo and video footage of said cats and of the environment they are in. As a result, we hope to see how the relative social or professional position of the area affects the well-being and welfare of the strays.
Field Trip
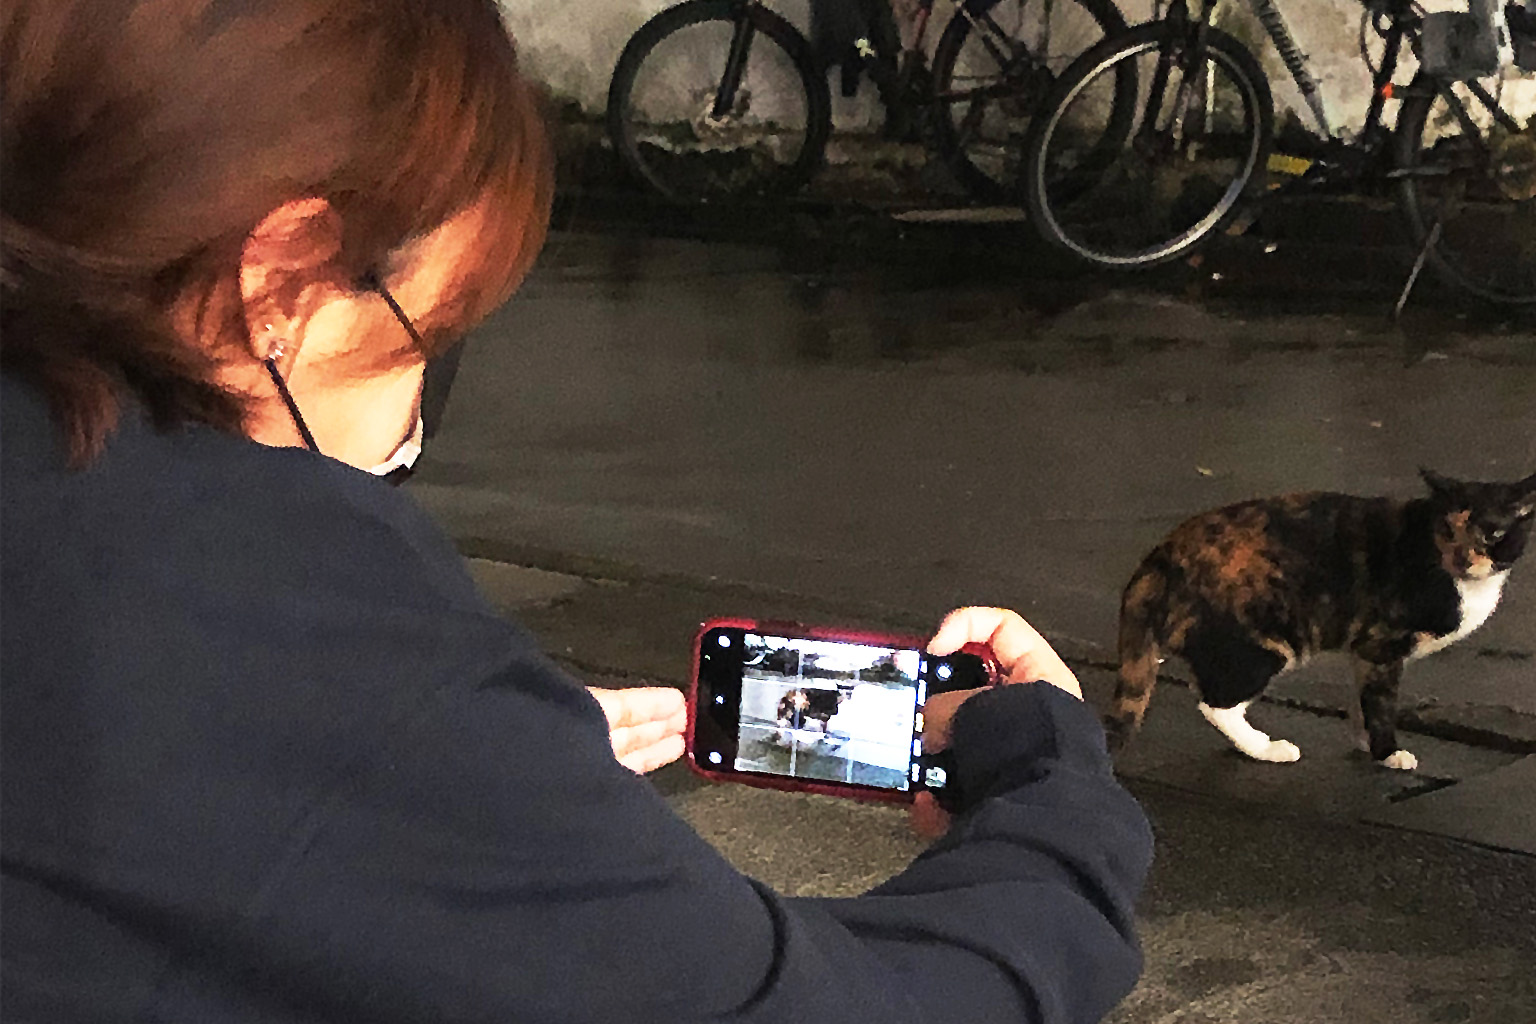
Given the case that Rossane is still in Indonesia, the other two members (Farhan and Nurfatin) decided to go on this field trip separately so that more areas in Singapore can be covered to collect more data. Initially, the plan was to go to only five different places at two different timings (day/night) to collect ten entries of data. However, the team came to a realisation after the first field trip that the same data will be collected no matter the day.
This is due to the fact that, as researched, stray cats in Singapore are more so community cats than stray. Hence, they belong to the part of the community; the community has become their home. The strays rarely migrate from one place to another to find new territories, as you’d see how feral cats do. Due to this, each of the two members decided to go to ten different places instead.
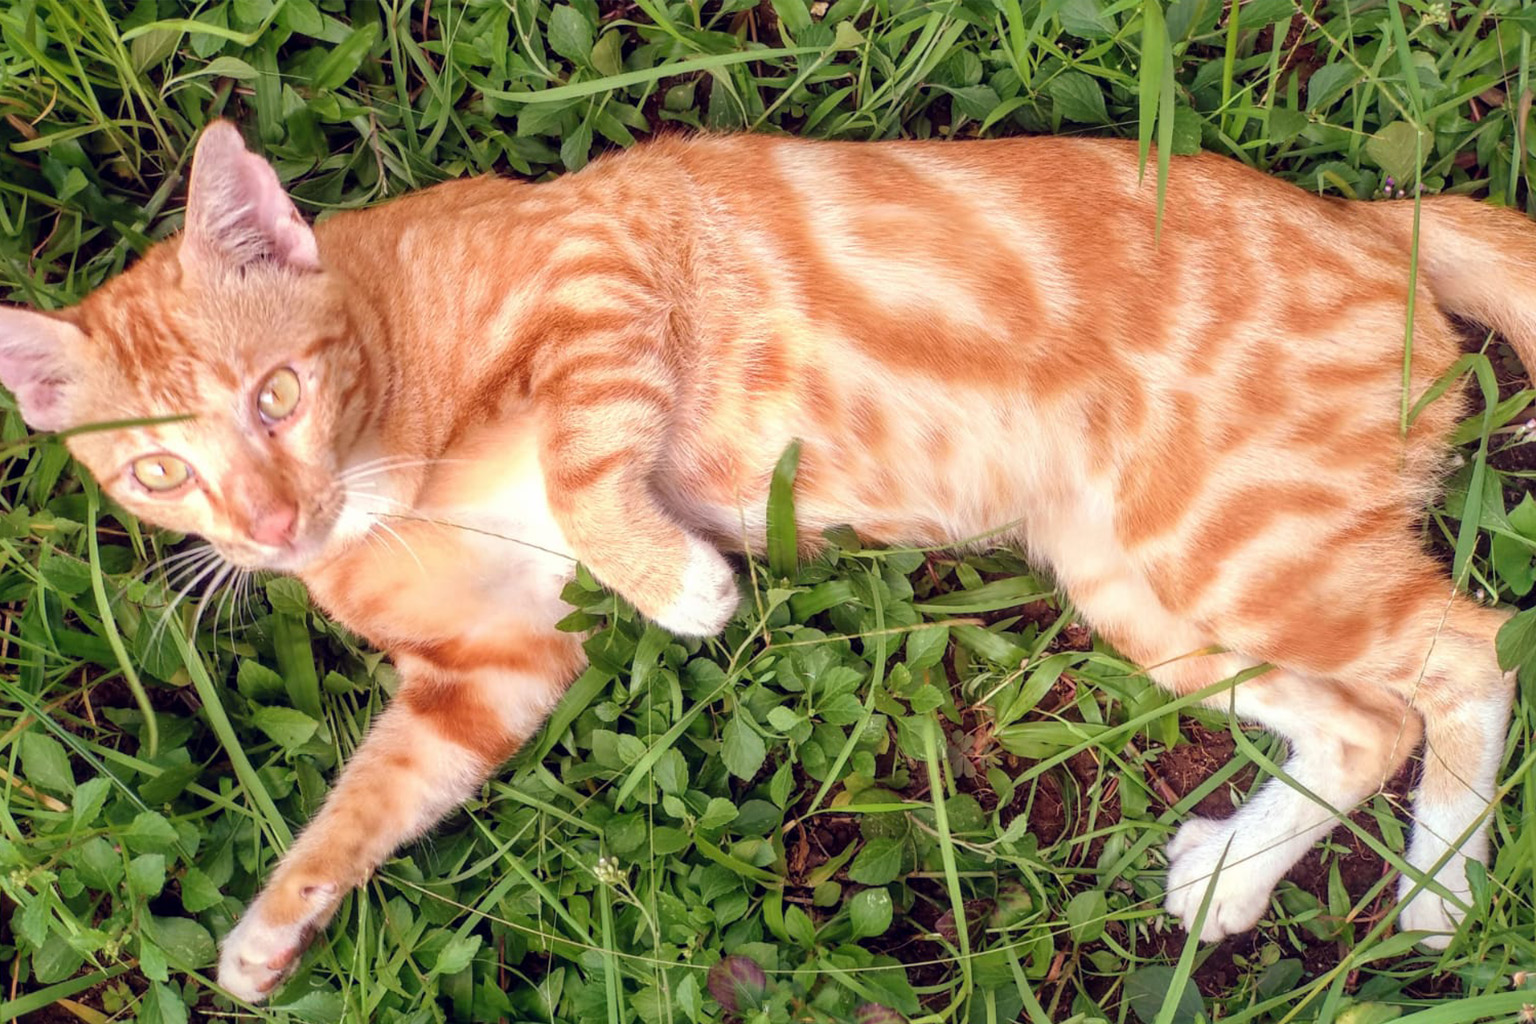
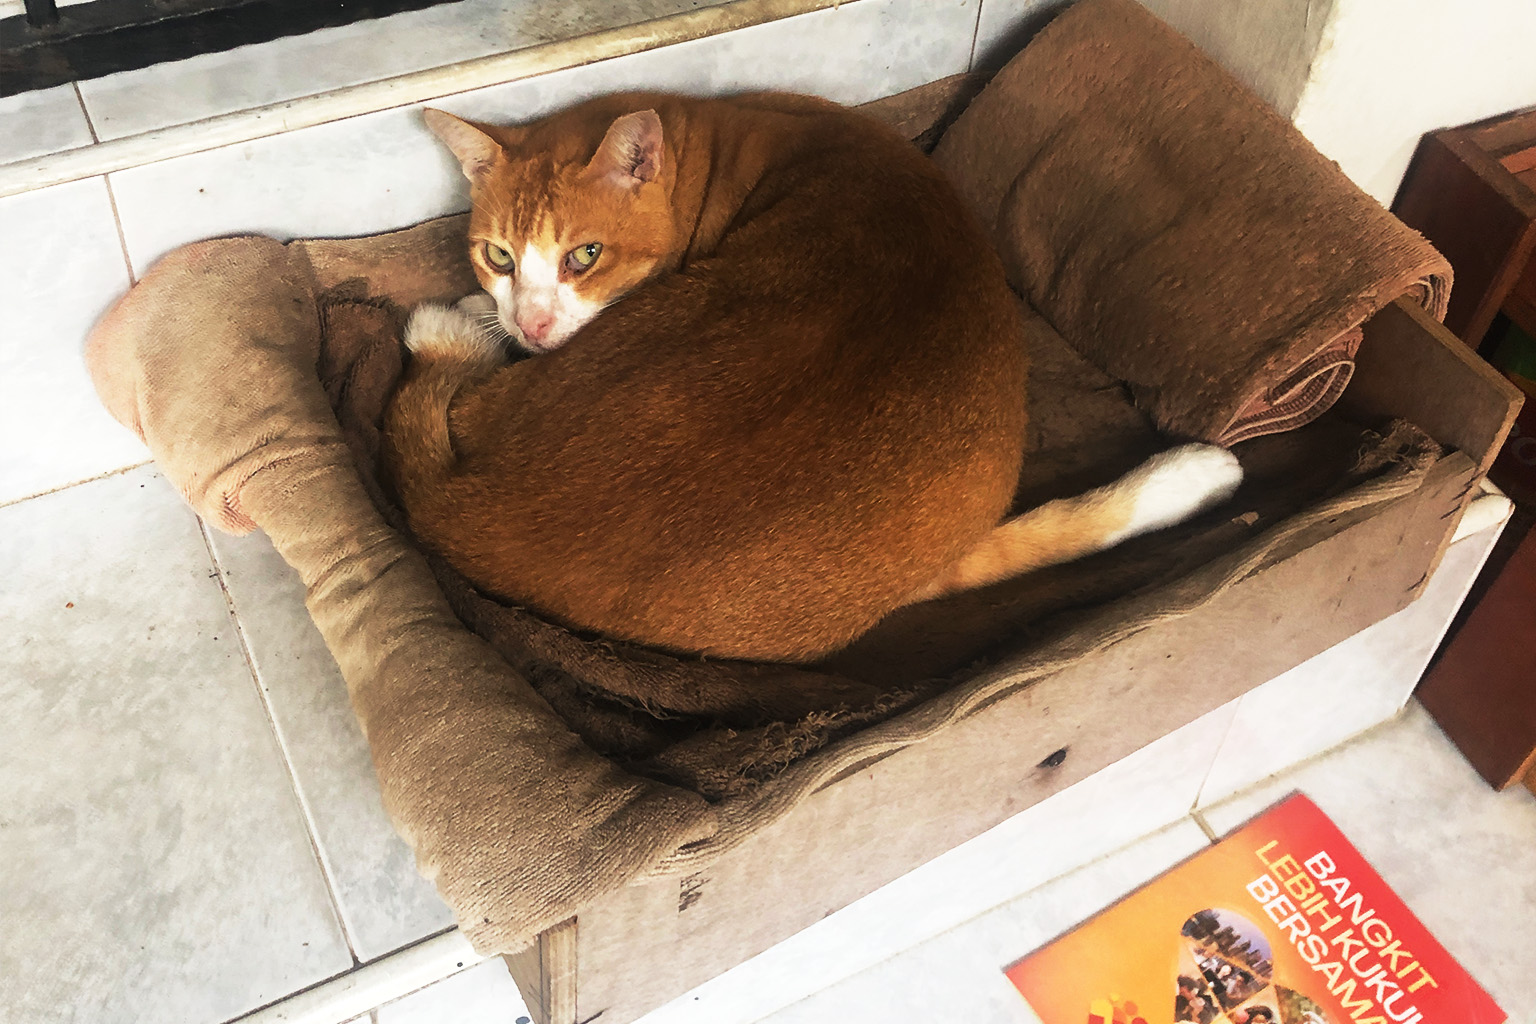
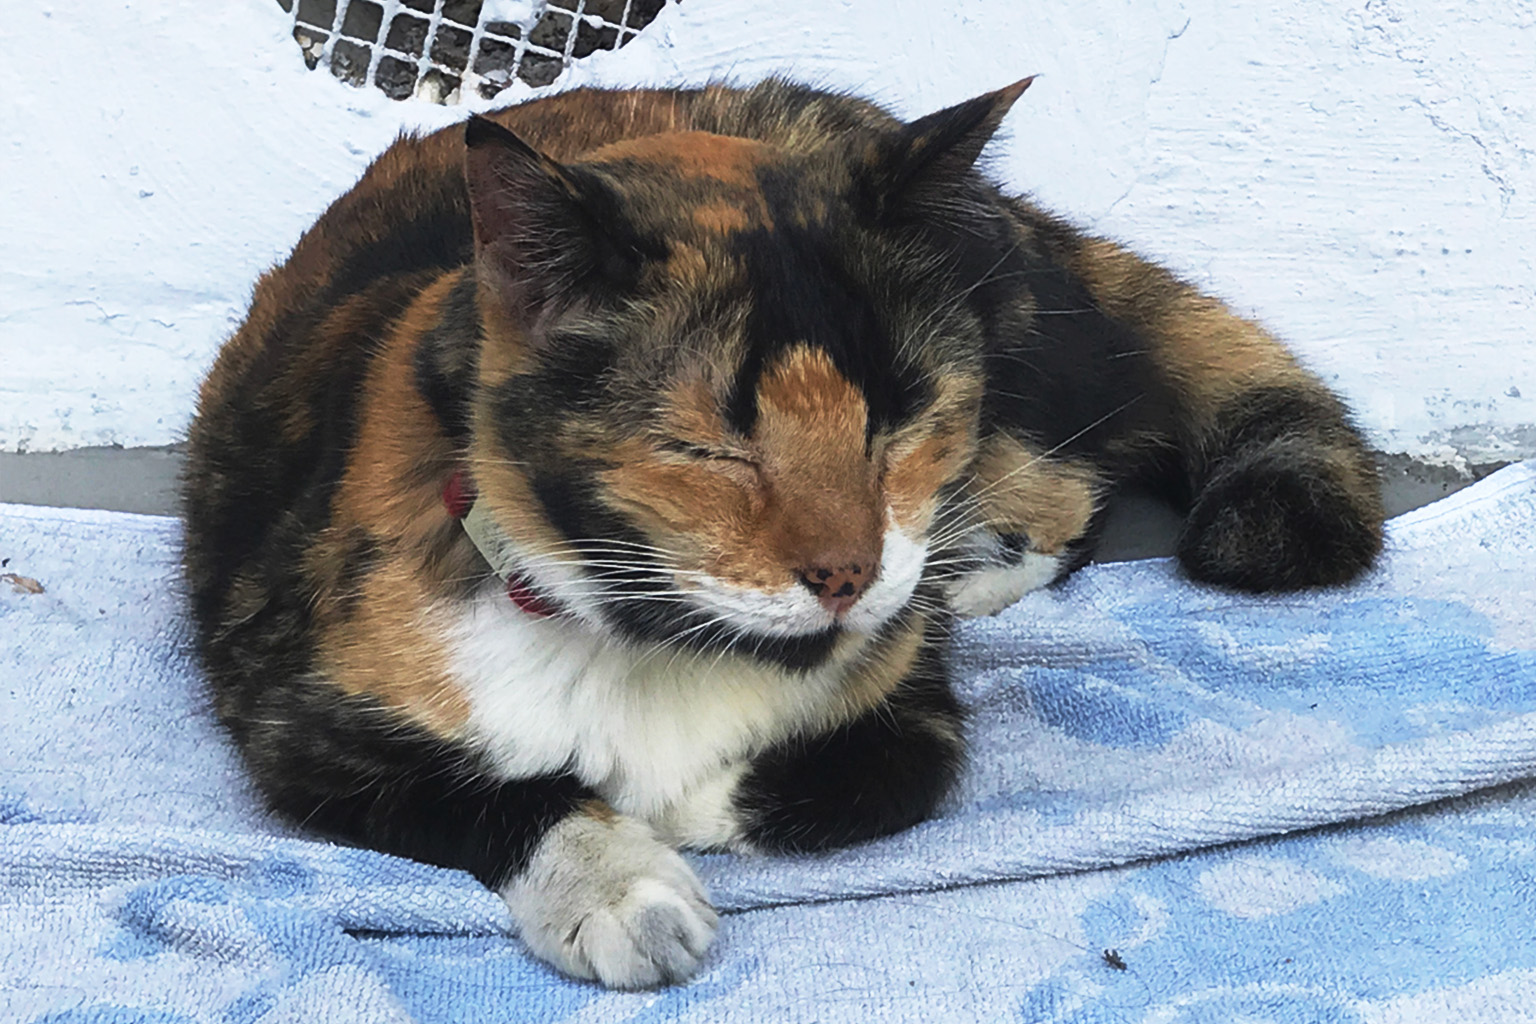
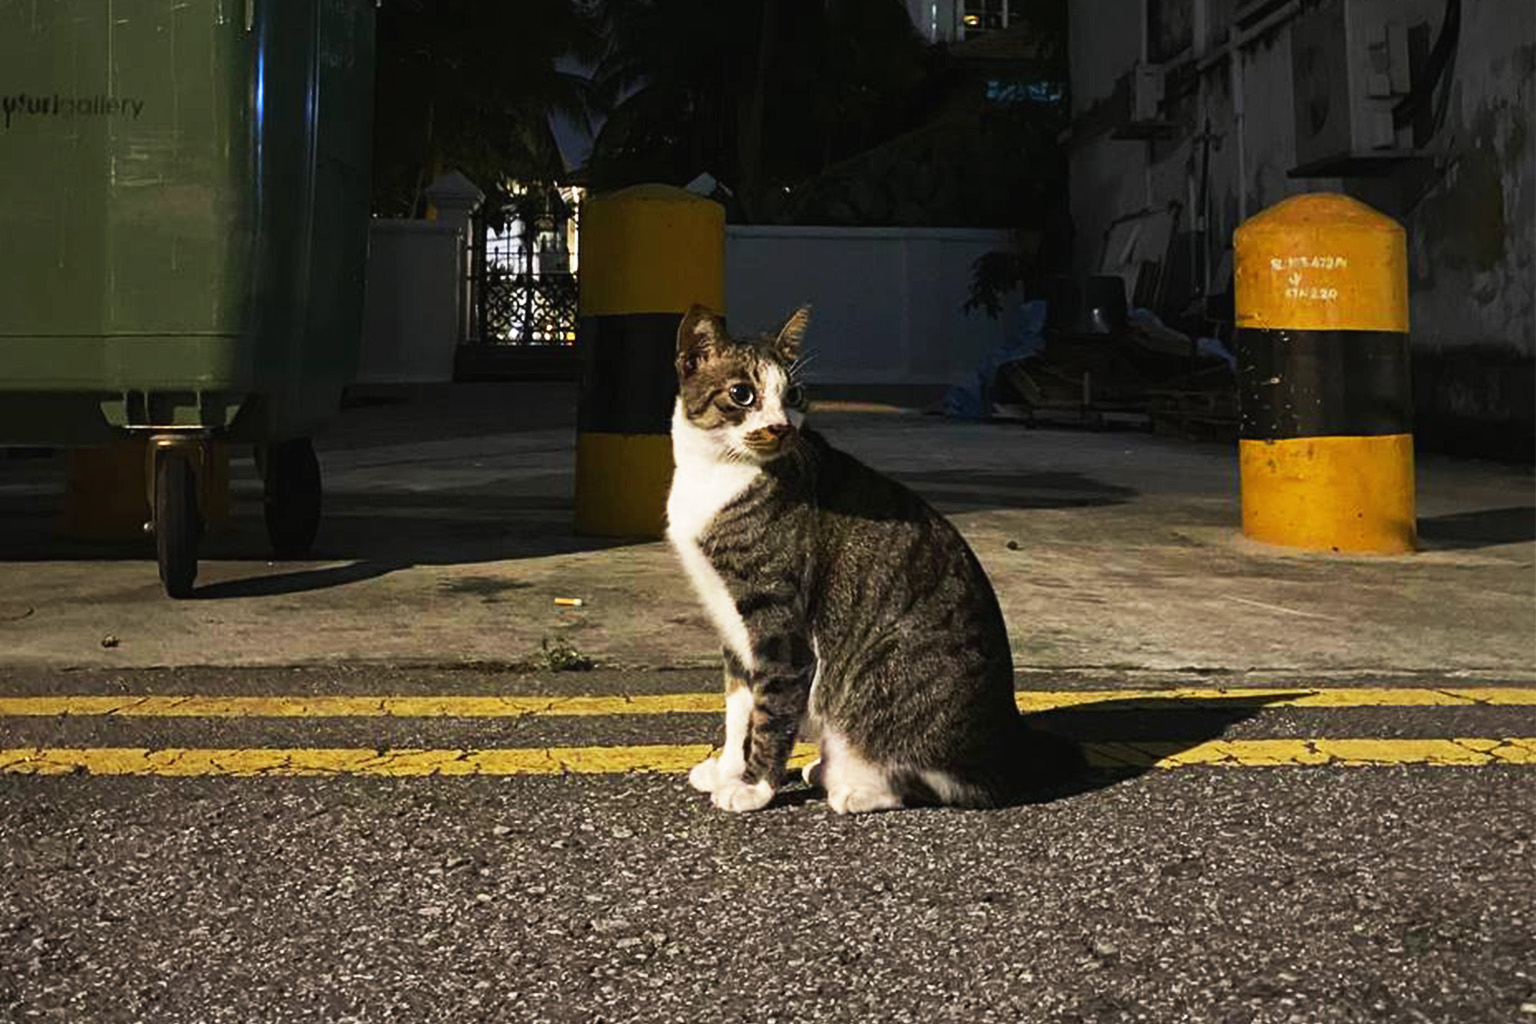
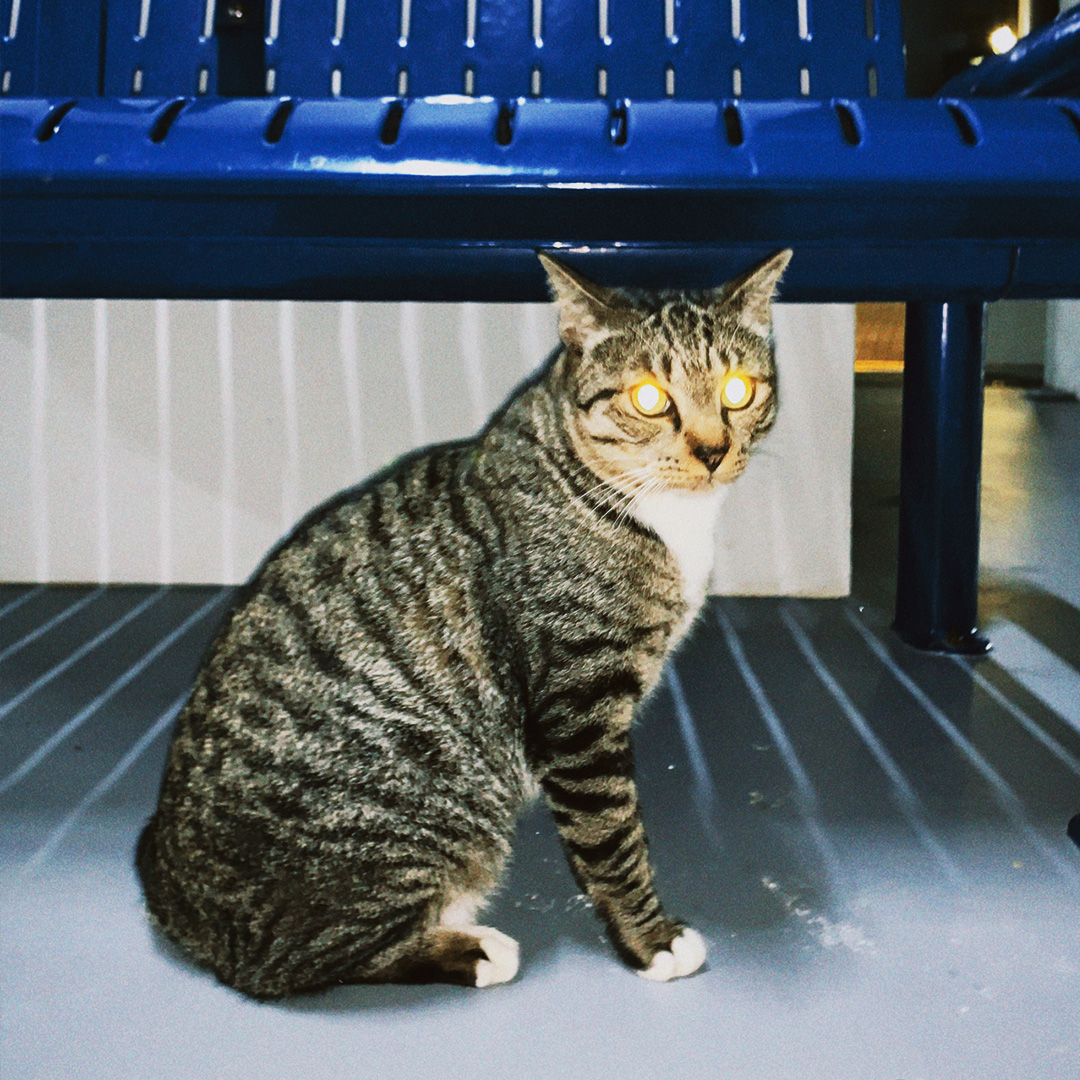
Our Field Trip Gallery
Data
Since our data involved a lot of moving around across the land, we decided that the 2D and 3D mapping graphs were best to visualise our data.
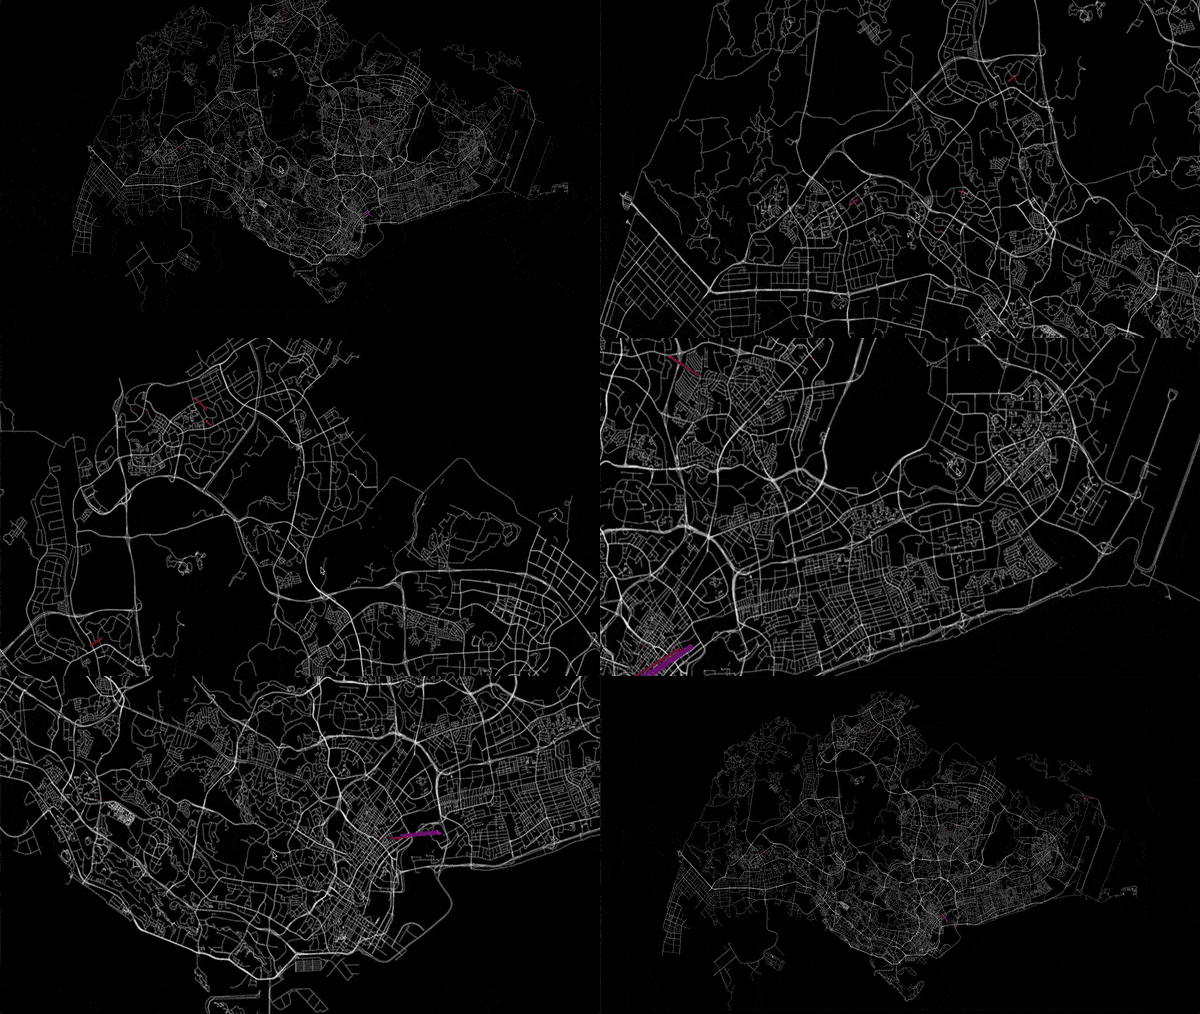
From the graph above we can conclude the following: please elaborate here in at least two sentences.
Below you can find an excerpt from the data we have used. Based on a data set on Climate Change recorded since 1896, we have extracted the following data points that we have worked with:
| Region | No. of community cats |
|---|---|
| North | 10 |
| South | 12 |
| Central | 11 |
| East | 9 |
| West | 13 |
Artefact
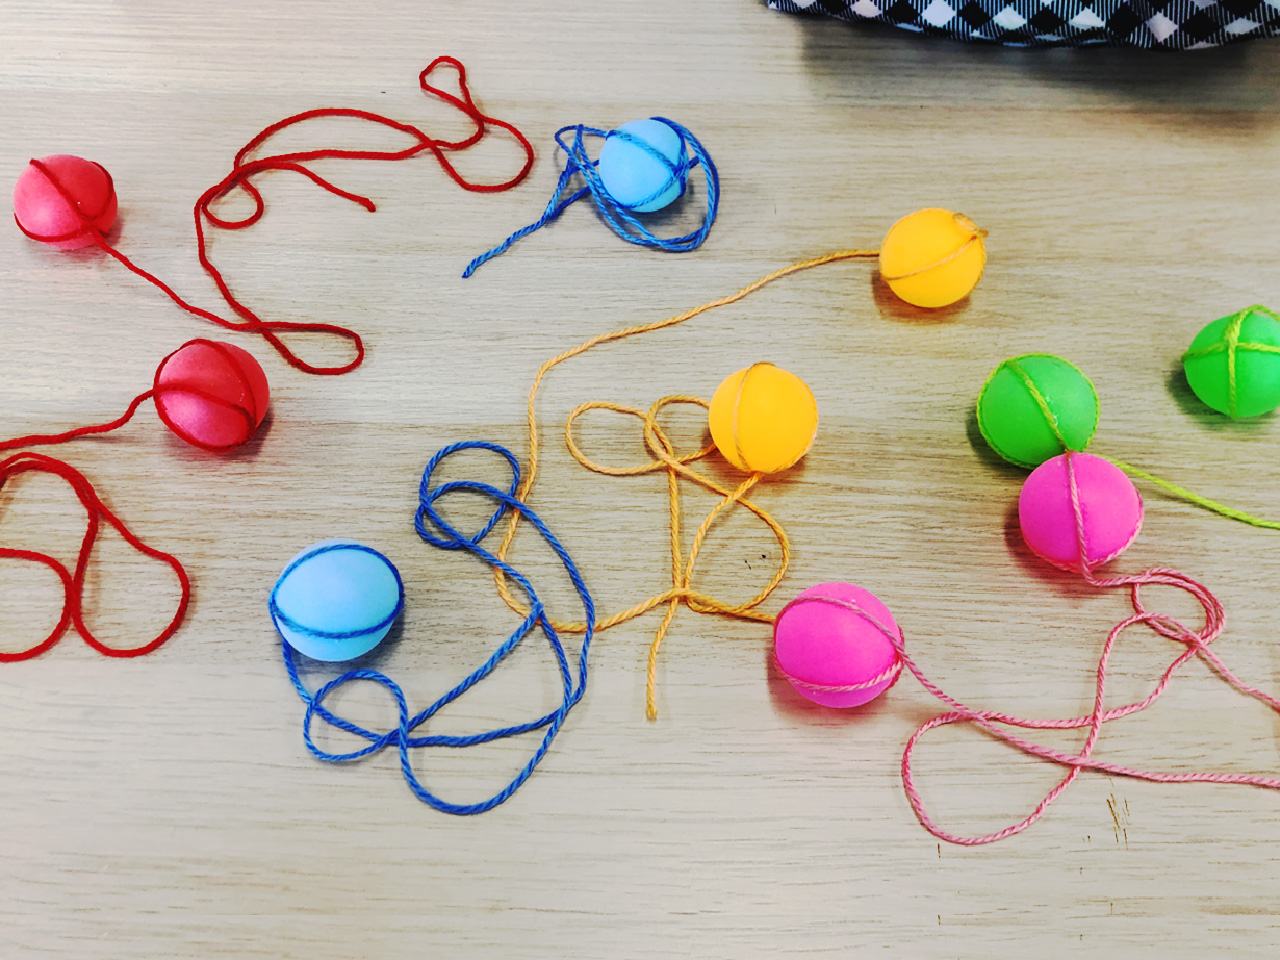
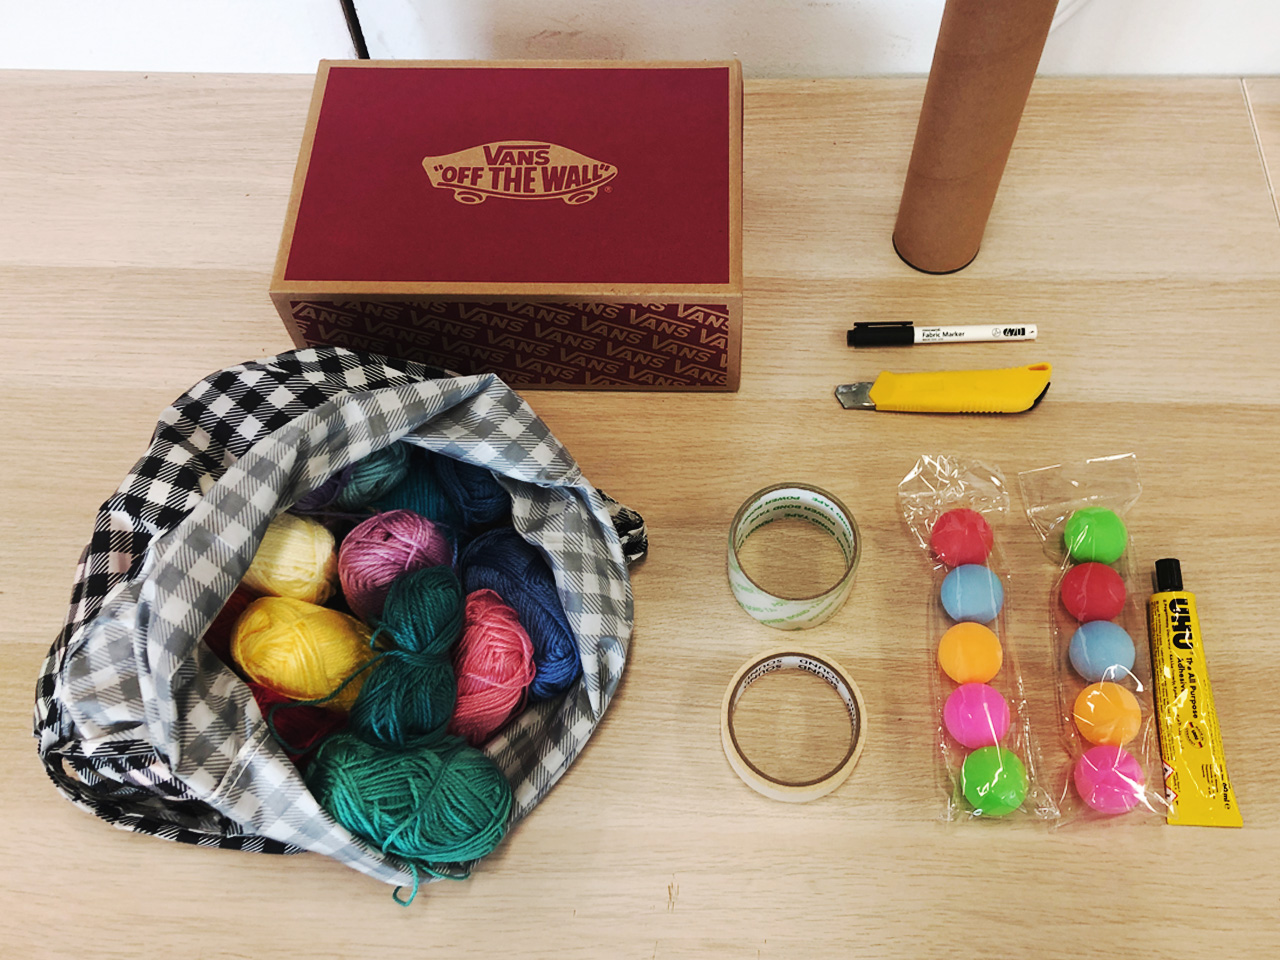
For our artefact, we decided to go with data physicalisation. We were very inspired by cat scratching poles/boards. We thought of different materials that we could explore with such as cardboard boxes (drawing inspirtation from the "homes" of these strays) and yarn (to mimic the sisal ropes typically used for scratching posts). We then decided to recreate a cat scratcher post, using the yarns to indicate and represent the data following the regions. The colours of the different regions are inspired by the Singapore Mass Rapid Transit (MRT) lines.
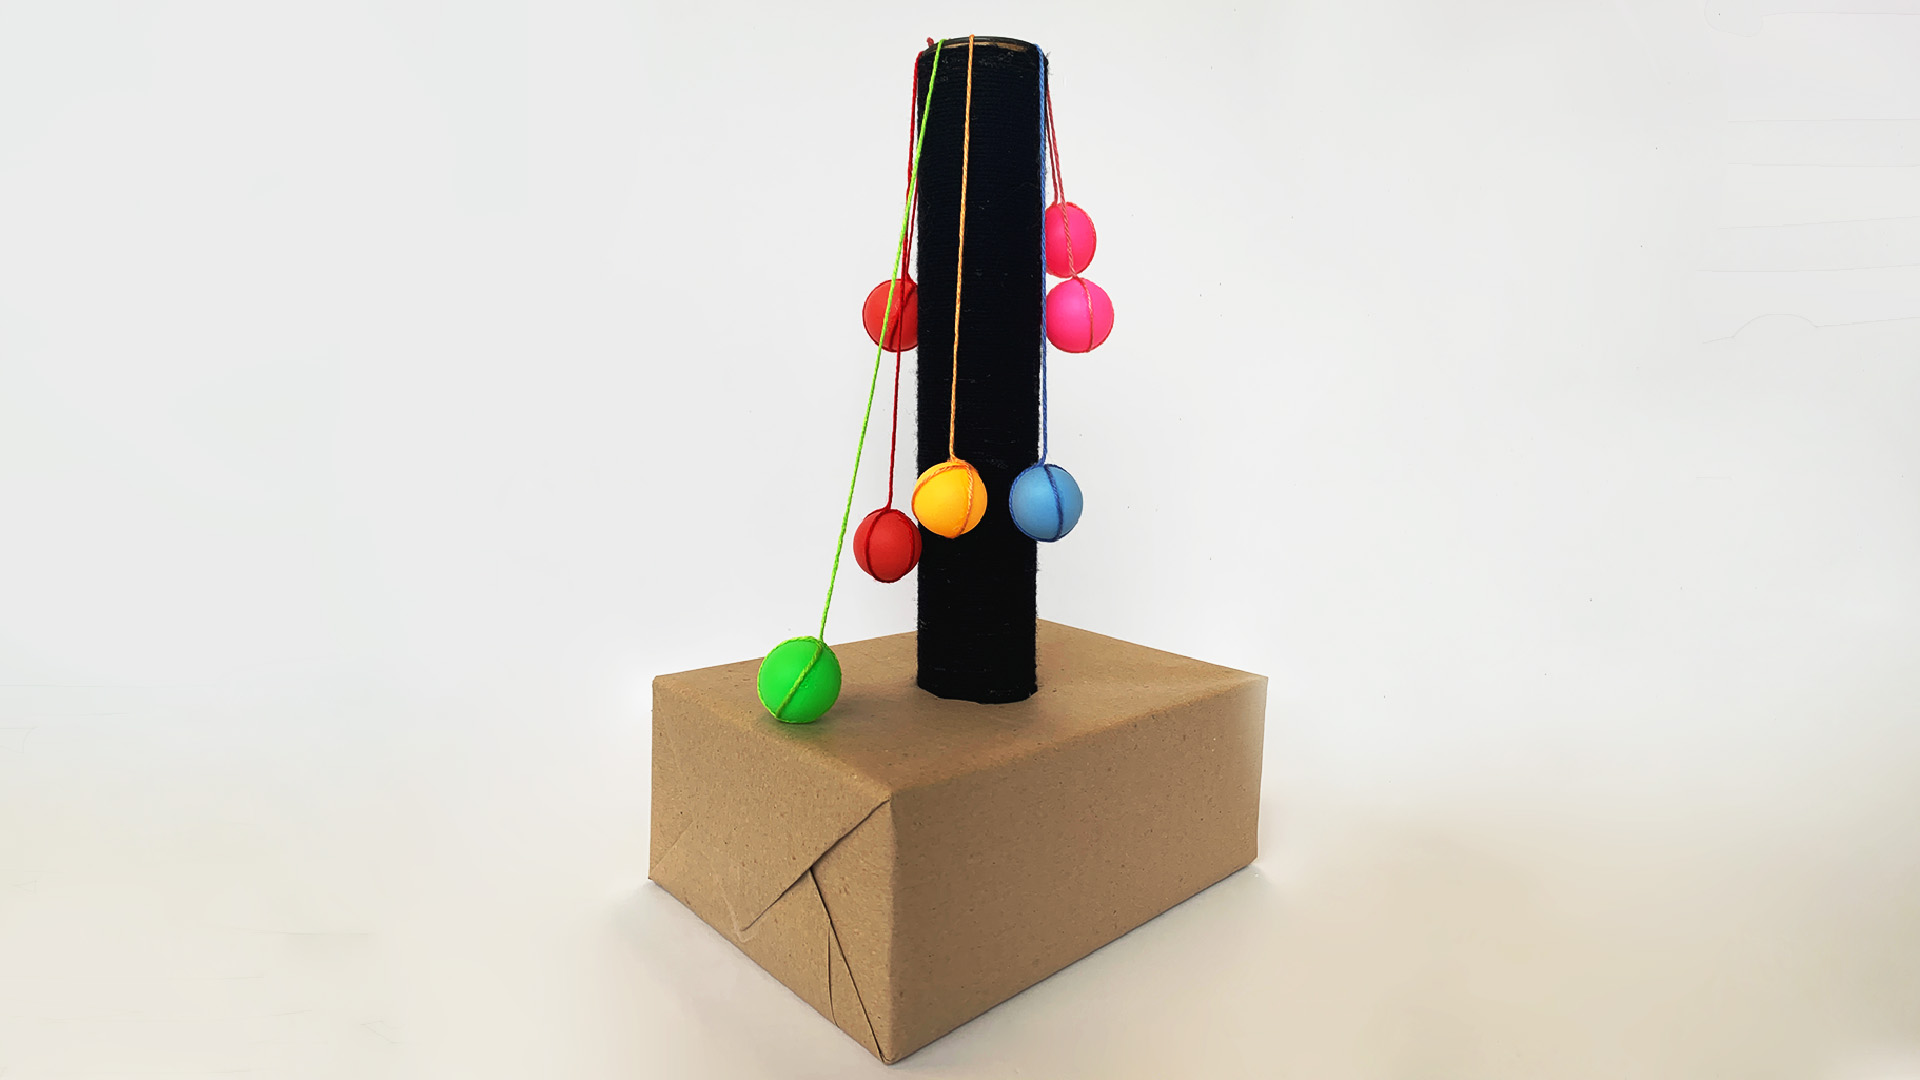
We tried out best to make use of materials we already had; things that we could find in our homes. We used simple materials that are familiar to the context of strays and cats such as cardboard. We repurposed a shoebox as the base and a poster tube for the post. We attached coloured ping-pong balls for more emphasis on the data representation. lacus.
Reflection
Overall, the field trip has been a wholesome experience. It has forced us to be more observant and aware of the habitats that coexist with and among us. Eventhough there was some up and downs during our data collection, we still manage to pull through and find what we want.
